import numpy as np
import h5py
import matplotlib.pyplot as plt

%matplotlib inline
plt.rcParams['figure.figsize'] = (5.0, 4.0) # set default size of plots
plt.rcParams['image.interpolation'] = 'nearest'
plt.rcParams['image.cmap'] = 'gray'

%load_ext autoreload
%autoreload 2

np.random.seed(1)Edge Detection
The easiest way to tackle CNNs is by covering edge detection, both vertically and horizontally as that’s the basis of detecting objects. Let’s focus on just greyscale colors for now.
As we talked about earlier CNN transform a large input image into a much smaller output and it does it through convolution (a type of multiplying with a smaller filter) usually many filters.
- As you see below if we start with a 6x6 image and convolute it with a 3x3 filter we end up with a 4x4 output.
- The way you calculate the values in the 4x4 output is by transposing the filter starting in the upper corner
- Multiply each value in the 9 input cells with the corresponding cells in the filter and add them up to give us the value in the first upper left corner of the output
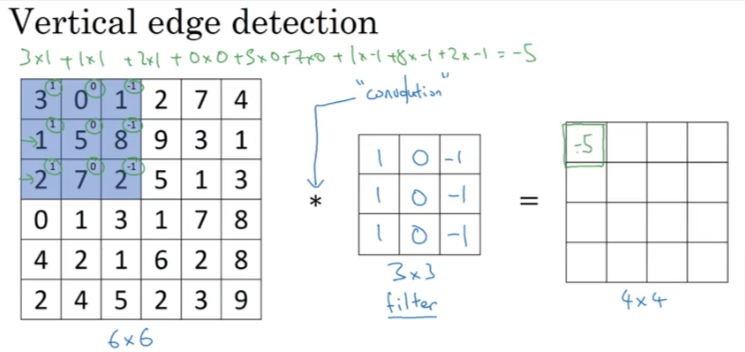
- You continue the process till all the summations are shown in the output
- Now let’s say we have the following input below convoluted with another 3x3 filter
- You see how the output has detected the vertical edge in a much smaller output
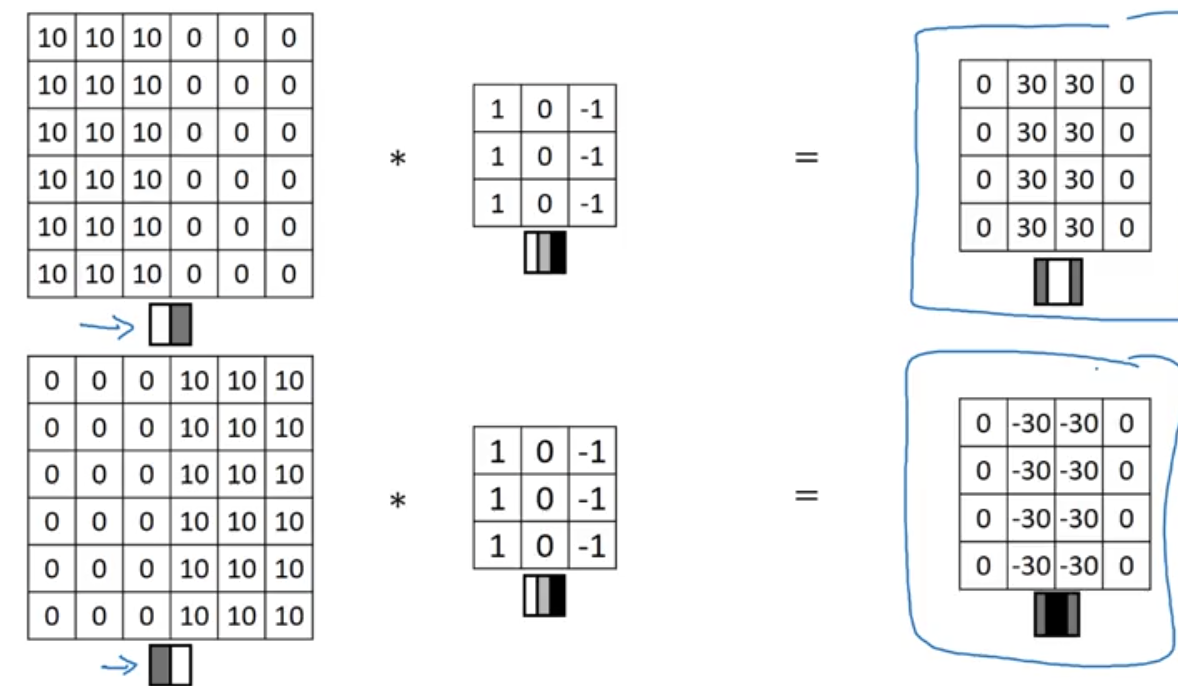
- So now as you see how we can detect edges both vertical and horizontal

- Many have experimented by changing the values to 1,0,-1 & 2,0,-2 & 1,0,-1 for the V filter
- Or even use: [3,0,-3], [10,0,-10], [3.0.-3]
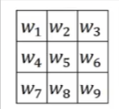
- So how do we know what values to use to capture the details of the data? And what if we want to detect the edges at 45, 60, 75 … or whatever degrees we wish to
- We set the values to the parameters as shown below
Padding
- As we saw above if we use input to be 6x6 and filter as 3x3 we will always end up with 4x4
- So if we use several filters, then the image becomes very small quickly
- Also note that the edge cells are only used once as we move the filter outline over to the next cell
- We can pad the image all around the edge then the corner cells are used more than once and hence have a better effect on the output.
- We simply add cells that contain 0’s all around the edge of the input
- The more important aspect of padding is
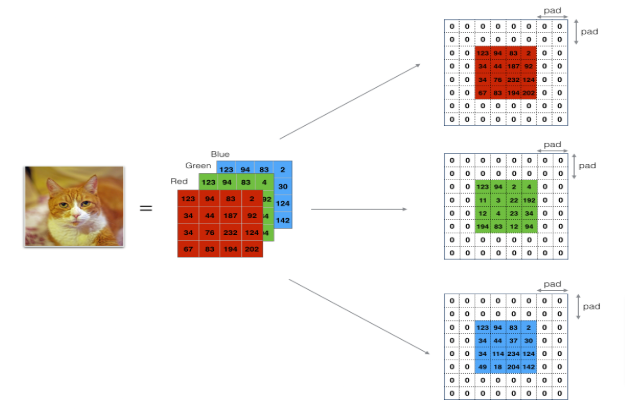
If we set p=1, or we add a cell all the way around the 6x6 image then we end up with an 8x8 image and when convoluted with a 3x3 we will have an output of 6x6 which is the same as the input image. This way we preserve the size for multiple processing before we decide to shrink the input size. This will yield better results
Valid Padding
Is when we don’t use any padding
Same Padding
When we pad so the output size is the same as the input size
Reason for Padding
It allows you to use a CONV layer without necessarily shrinking the height and width of the volumes. This is important for building deeper networks, since otherwise the height/width would shrink as you go to deeper layers. An important special case is the “same” convolution, in which the height/width is exactly preserved after one layer.
It helps us keep more of the information at the border of an image. Without padding, very few values at the next layer would be affected by pixels as the edges of an image.
Strided Convolution
Instead of moving the filter over to the next cell we can make it stride=jump over the amount of stride to the corresponding cell
- So let’s say we start with a 7x7 input matrix and we set stride =2
- Using a filter of 3x3 we will end up with a 3x3 output
- What if we choose a stride that leaves the furthest overlap on the right or bottom hanging over the edge (meaning some cells will not have a value to multiply with), then we omit the entire 3x3 calculation of that stride
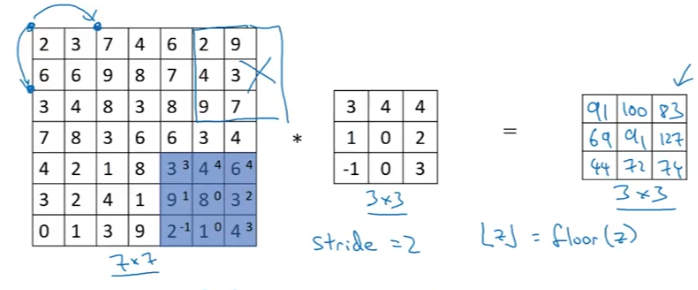
Here is a recap of the the three options we covered so far, the output size will have the image in the formula, the symbols in the formula mean: round down to the nearest whole integer
Convolution & RGB
So far we’ve been working with 2D images, so what changes when we use 3D volumes. In other words what happens when we use colored rgb images?
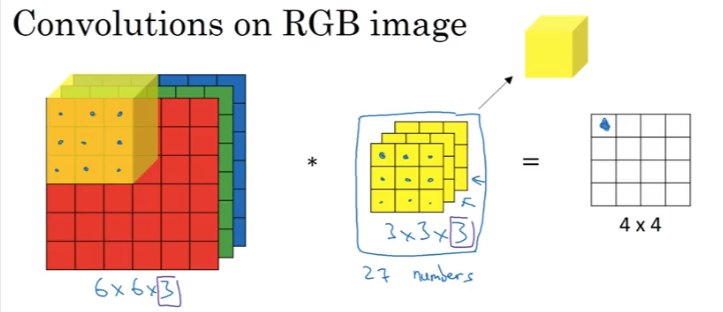
Our colored image will now have a stack of 3 6x6 images (if we use the same size as above). How do we use convolution on colored images?
All we do is increase our filter to have 3 layers - channels to match our input image, sometimes we call it a cube. nc - the number of channels for both the input and filters have to be equal.
- Just as did above, which is overlaying the filter over the input upper left corner
- This time we will take all 3 layers/channels and multiply each value with the corresponding channel in the input
- Sum all 3x3x3 = 27 numbers and put the result in the upper left cell of the output
- So now instead of having the sum of 9 numbers we have the sum of 27 numbers
Purpose
Let’s say we only want to detect edges in the RED channel, then we can set the filter’s first layer to detect the edge and set the GB channels values to 0.
This will output detected edges in the red channel. If we want to detect vertical edges on all channels then we set all 3 channels in the filter to detect vertical edges as shown in the image belo
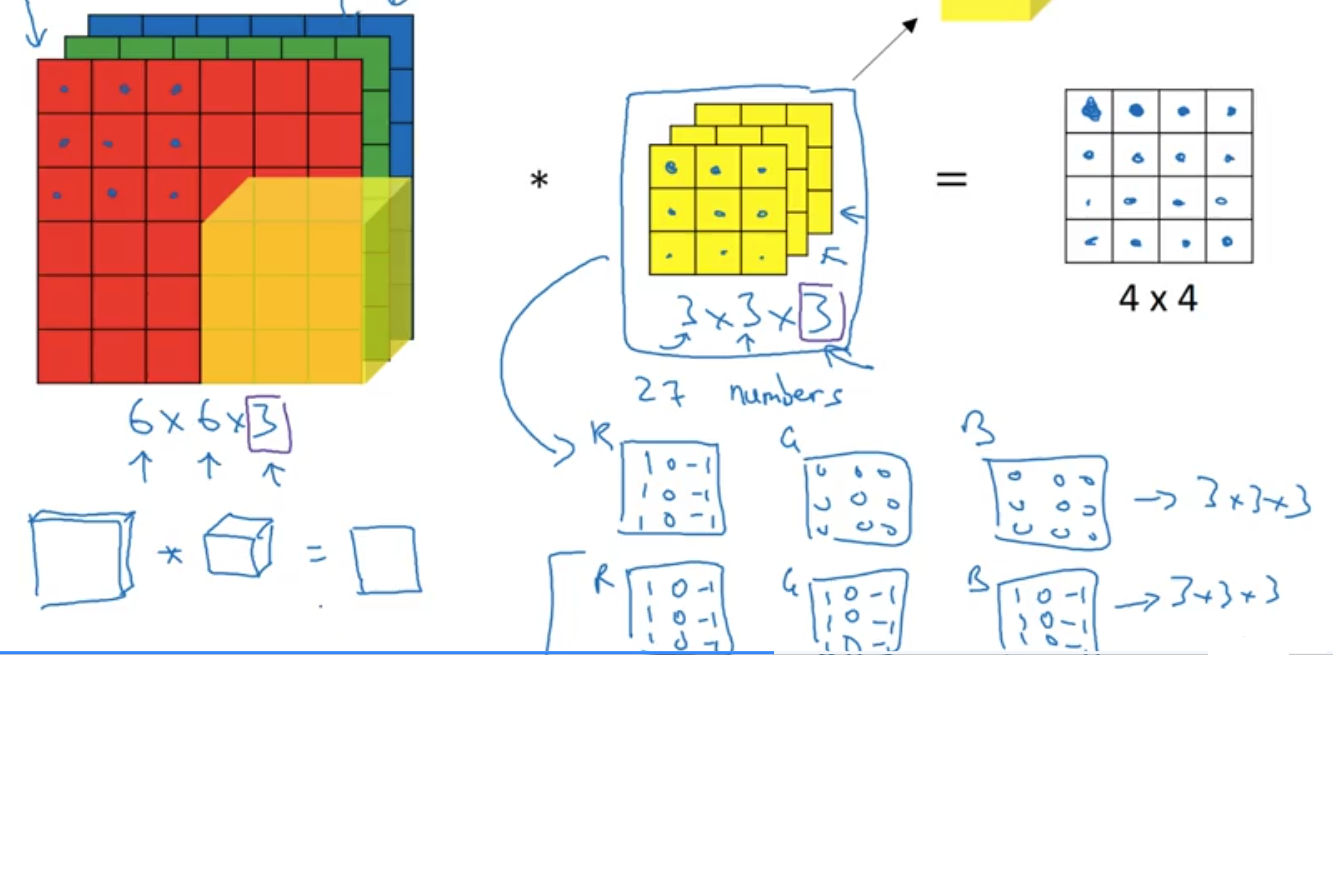
- What if we want to detect other edges, let’s say horizontal or 45 or 79… Then all we do is add another filter for our purpose
- Here below we add a horizontal filter as well
- This will give us two outputs one for each
- We then layer the two outputs together to give us a cube output 4x4x2 for the two filters we used, instead of the simple 4x4 matrix we had earlier
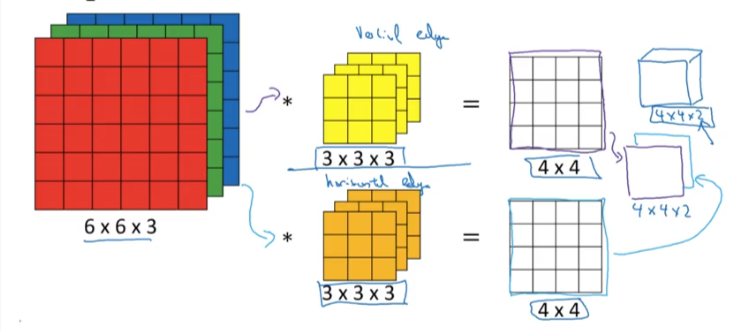
We will continue this model in the next page: One Layer Convolution
Code
Padding
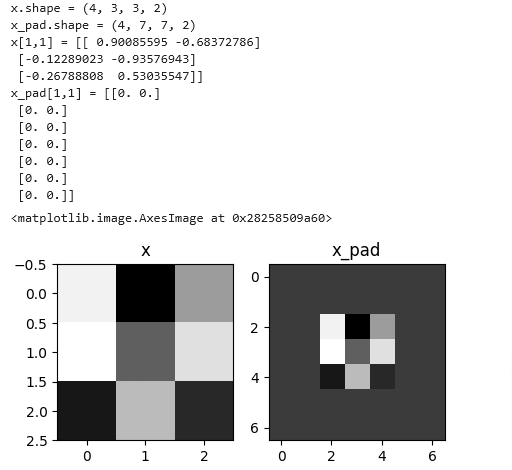
Let’s add p=2 to X a python array of shape (m, n_H, n_W, n_C)
Pad Function
def zero_pad(X, pad):
    """
    Pad with zeros all images of the dataset X. The padding is applied to the height and width of an image,
    as illustrated in Figure 1.

    Argument:
    X -- python numpy array of shape (m, n_H, n_W, n_C) representing a batch of m images
    pad -- integer, amount of padding around each image on vertical and horizontal dimensions

    Returns:
    X_pad -- padded image of shape (m, n_H + 2*pad, n_W + 2*pad, n_C)
    """

    ### START CODE HERE ### (≈ 1 line)
    X_pad = np.pad(X,((0,0),(pad,pad),(pad,pad),(0,0)),'constant')
    ### END CODE HERE ###

return X_padnp.random.seed(1)
x = np.random.randn(4, 3, 3, 2)
x_pad = zero_pad(x, 2)
print ("x.shape =", x.shape)
print ("x_pad.shape =", x_pad.shape)
print ("x[1,1] =", x[1,1])
print ("x_pad[1,1] =", x_pad[1,1])
fig, axarr = plt.subplots(1, 2)
axarr[0].set_title('x')
axarr[0].imshow(x[0,:,:,0])
axarr[1].set_title('x_pad')
axarr[1].imshow(x_pad[0,:,:,0])