import os
import cv2
import numpy as np
import matplotlib.pyplot as plt

from zipfile import ZipFile
from urllib.request import urlretrieve

from IPython.display import YouTubeVideo, display, Image

%matplotlib inlineDownload Assets
Pose Estimation - OpenPose
In this page we will estimate realtime Multi-Person 2D Pose Estimation using Part Affinity Fields. The model will accept an image of one or more people, it will associate a key point in the major joints of the human anatomy and logically connect the key points. Produce an affinity map and confidence(probability) map.
Clothing can obscure the joints, joints can be hidden from view, and associating a joint to the right person were some of the issues in the past.
We will use the OpenPose CAFFE model that was trained on the multipurpose image dataset. Pose estimation is most useful on video clips which we will cover as well.
Setup
def download_and_unzip(url, save_path):
    print(f"Downloading and extracting assests....", end="")

    # Downloading zip file using urllib package.
    urlretrieve(url, save_path)

    try:
        # Extracting zip file using the zipfile package.
        with ZipFile(save_path) as z:
            # Extract ZIP file contents in the same directory.
            z.extractall(os.path.split(save_path)[0])

        print("Done")

    except Exception as e:
        print("\nInvalid file.", e)
URL = r"https://www.dropbox.com/s/089r2yg6aao858l/opencv_bootcamp_assets_NB14.zip?dl=1"
asset_zip_path = os.path.join(os.getcwd(), "opencv_bootcamp_assets_NB14.zip")
# Download if assest ZIP does not exists.
if not os.path.exists(asset_zip_path):
download_and_unzip(URL, asset_zip_path)Load CAFFE Model
A typical Caffe Model has two files
- Architecture : Defined in a .prototxt file
- Weights : Defined in .caffemodel file
protoFile   = "pose_deploy_linevec_faster_4_stages.prototxt"
weightsFile = os.path.join("model", "pose_iter_160000.caffemodel")- Specifying the number of points in the model
- List the pairing of the joint numbers by their indices
- These are linkage of the joints of the human anatonamy
nPoints = 15
POSE_PAIRS = [
    [0, 1],
    [1, 2],
    [2, 3],
    [3, 4],
    [1, 5],
    [5, 6],
    [6, 7],
    [1, 14],
    [14, 8],
    [8, 9],
    [9, 10],
    [14, 11],
    [11, 12],
    [12, 13],
]

# Call the CAFFE model and have an instance of it in net
net = cv2.dnn.readNetFromCaffe(protoFile, weightsFile)
Read Image
# Read image, then convert color to match opencv
im = cv2.imread("Tiger_Woods_crop.png")
im = cv2.cvtColor(im, cv2.COLOR_BGR2RGB)

# Acquire the image dimensions dynamically
inWidth  = im.shape[1]
inHeight = im.shape[0]
Preview Image
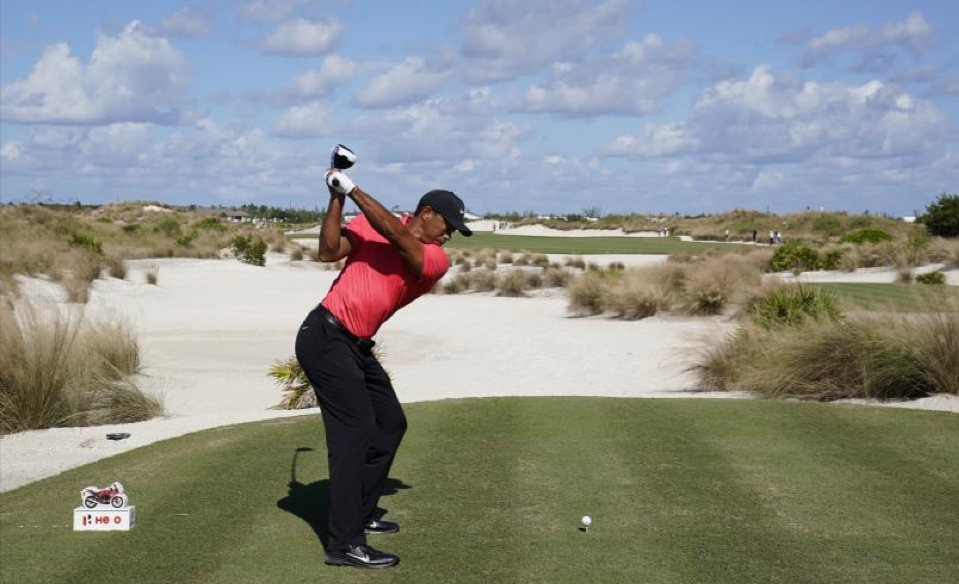
Image(filename="Tiger_Woods.png")
Convert Image to Blob
netInputSize = (368, 368)
inpBlob = cv2.dnn.blobFromImage(im, 1.0 / 255, netInputSize, (0, 0, 0), swapRB=True, crop=False)
net.setInput(inpBlob)
Run Inference
# Forward Pass
output = net.forward()

# Display probability maps
plt.figure(figsize=(20, 5))
for i in range(nPoints):
    probMap = output[0, i, :, :]
    displayMap = cv2.resize(probMap, (inWidth, inHeight), cv2.INTER_LINEAR)

    plt.subplot(2, 8, i + 1)
    plt.axis("off")
    plt.imshow(displayMap, cmap="jet")
Extract Points
# X and Y Scale
scaleX = inWidth  / output.shape[3]
scaleY = inHeight / output.shape[2]

# Empty list to store the detected keypoints
points = []

# Treshold
threshold = 0.1

for i in range(nPoints):
    # Obtain probability map
    probMap = output[0, i, :, :]

    # Find global maxima of the probMap.
    minVal, prob, minLoc, point = cv2.minMaxLoc(probMap)

    # Scale the point to fit on the original image
    x = scaleX * point[0]
    y = scaleY * point[1]

    if prob > threshold:
        # Add the point to the list if the probability is greater than the threshold
        points.append((int(x), int(y)))
    else:
        points.append(None)
Display Points & Skeleton
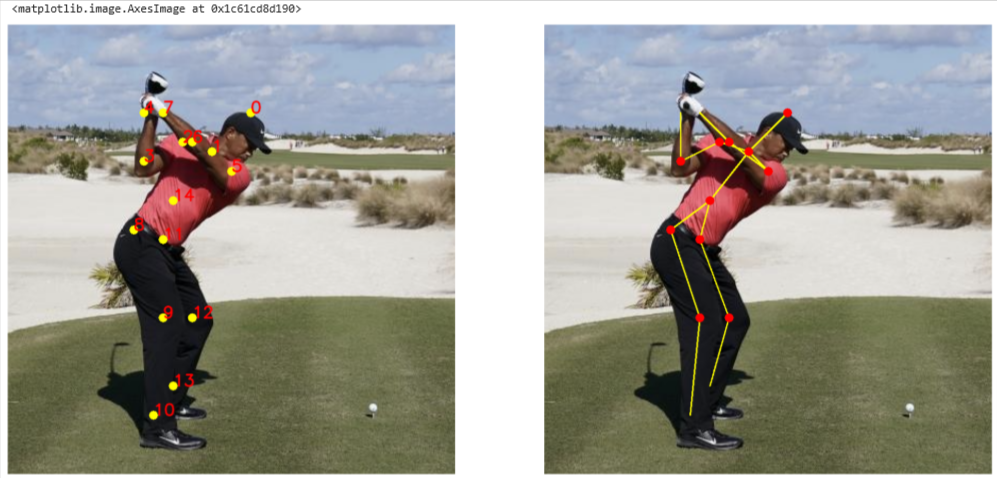
imPoints = im.copy()
imSkeleton = im.copy()

# Draw points
for i, p in enumerate(points):
    cv2.circle(imPoints, p, 8, (255, 255, 0), thickness=-1, lineType=cv2.FILLED)
    cv2.putText(imPoints, "{}".format(i), p, cv2.FONT_HERSHEY_SIMPLEX, 1, (255, 0, 0), 2, lineType=cv2.LINE_AA)

# Draw skeleton
for pair in POSE_PAIRS:
    partA = pair[0]
    partB = pair[1]

    if points[partA] and points[partB]:
        cv2.line(imSkeleton, points[partA], points[partB], (255, 255, 0), 2)
        cv2.circle(imSkeleton, points[partA], 8, (255, 0, 0), thickness=-1, lineType=cv2.FILLED)
# Plot
plt.figure(figsize=(50, 50))
plt.subplot(121)
plt.axis("off")
plt.imshow(imPoints)
plt.subplot(122)
plt.axis("off")
plt.imshow(imSkeleton)
