# Create a line for the counter
crossLine = [(376, 282), (682, 282)]

# Add line on image to verify
# Draw the line to cross for counter-red,thickness=5
cv2.line(frame,crossLine[0], crossLine[1],(0,0,255),5)Count Objects
Counting objects covers a wide range of applications. We could use it
- In an area where livestock cross for grazing, watering, head count….
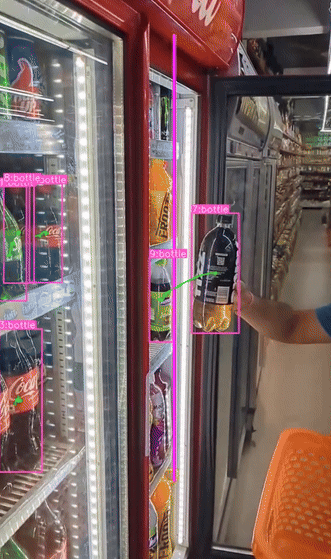
- In a retail operation as a customer moves an item out of the fridge it crosses an invisible line and is added to a counter….
- A manufacturing plant, cars, toll bridge
- An area in the park
- At airports
- Objects could be going in opposite directions, in diagonal motion….
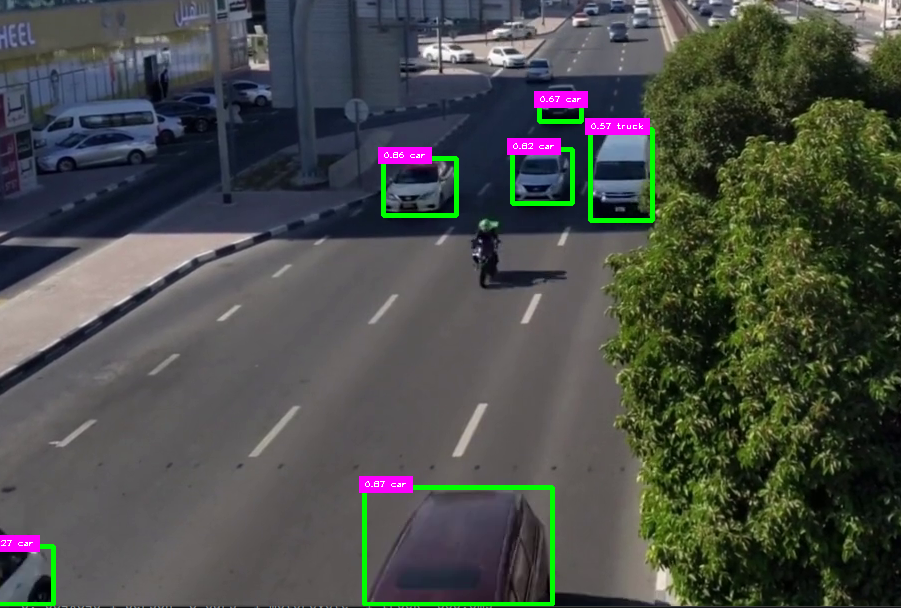
Let’s work with our car counting project we started earlier. Here is the latest image from that project:
Tracking
- Since we have a mask set in place already
- We already decided that the model is very accurate in detection right where the motorcycle happens to be in the image above
- We can draw an area across the road where each object will cross (unless they wreck) and once they cross it we can increase the count by one
- We have to be careful not to limit our line to a single pixel, and not to make it too large this way we can make sure that even if the model doesn’t detect it in every frame it will still be caught in another frrame
- We also have to implement Tracking. Why?
- Well we have to be able to track an object as soon as it is detected that it is the same object moving down the screen. we don’t want to detect the same object in every frame and think it is a new object all together
- We want to be able to detect an object and then track it as it moves across the screen, this is where SORT comes in
- It will assign an ID to every object that is detected and then tracks that object down the screen as it moves using that unique ID
- So no two objects will have duplicates IDs
- Visit tracking page for details
Count
Set Cross Line
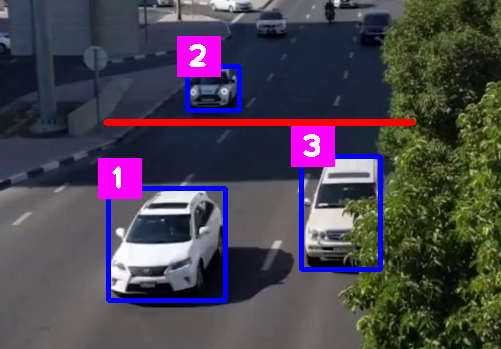
Now that we are tracking the objects from frame to frame, we can draw a line to use as a threshold. Once an object crosses it we will increment the counter.
We can use the center point of each object to detect the crossing has been accomplished
Center Point
To calculate the centerpoint of BB we just use w = x2-x1 and h=y2-y1
# midpoint would be x1 + half the width
w = x2 - x1
h = y2 - y1
cx, cy = x1 + w //2, y1 + h //2
# let's plot it on the image
cv2.circle(frame,(cx, cy),7,(255,0,0),cv2.FILLED)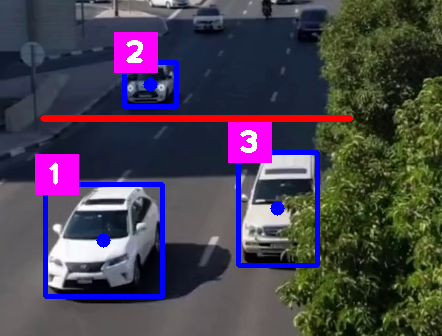
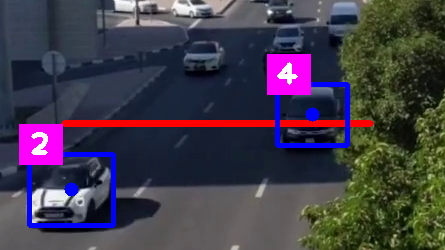
So as you see when it crosses the line as shown below we will count it
X Check
- Let’s check the x values first if they are inside the left and right edges of the red line
- Those x values would be crossLine[0][0] and crossLine[1][0]
- The first two coordinates then check to see if it crossed the line vertically (in this case)
Y Check
- We need to adjust this value based on the application of the counter.
- We can’t really expect to count when it crossed one single pixel. and we can’t make it so large that it would take too many frames to be counted. In our case here our y’s are at 282
- So we need to set the vertical window accordingly
- So let’s try a 40 pixel height region
if crossLine[0][0] < cx < crossLine[1][0] and
        crossLine[0][1] - 20 < cy < crossLine[0][1] + 20:
                totalCount +=1
Let’s display the count on the image
putTextRect(frame, f' Count: {totalCount}', ((50, 50)), scale=2, thickness=3, offset=10)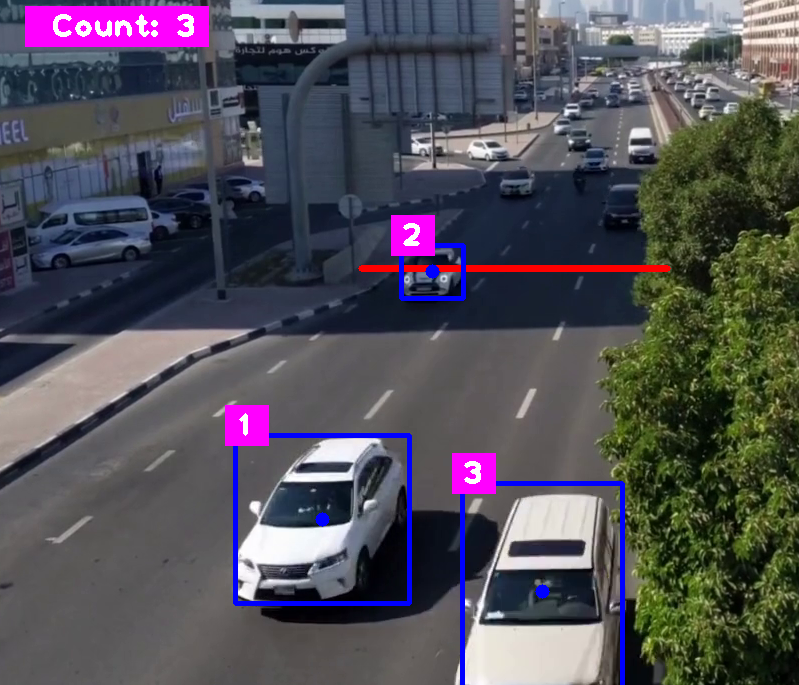
- What is noticeable is the fact that it counts the same ID multiple times as it moves from frame to frame inside our counting region
- So we have to check to see, if it counted that unique ID then it should not counted again while it’s in the region
- If we make the region very small it is possible that it might go through the region and not be counted
- So let’ s make totalCount a list to collect the IDs and check if an ID is in the list
- So in order to count the number of times an ID is in the list we use .count(Id)
- But now instead of displaying the totalCount we display the length of the list which will give us the number of objects that crossed the line
- So we edit the code to
totalCount = []

# Then append the new ID to the list as it crosses
if totalCount.count(Id) == 0:
        totalCount.append(Id)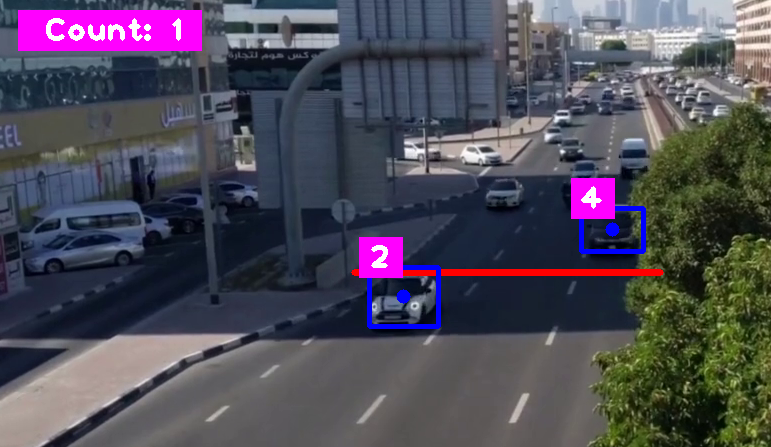
- As you see it only counted car 2 once in the above image
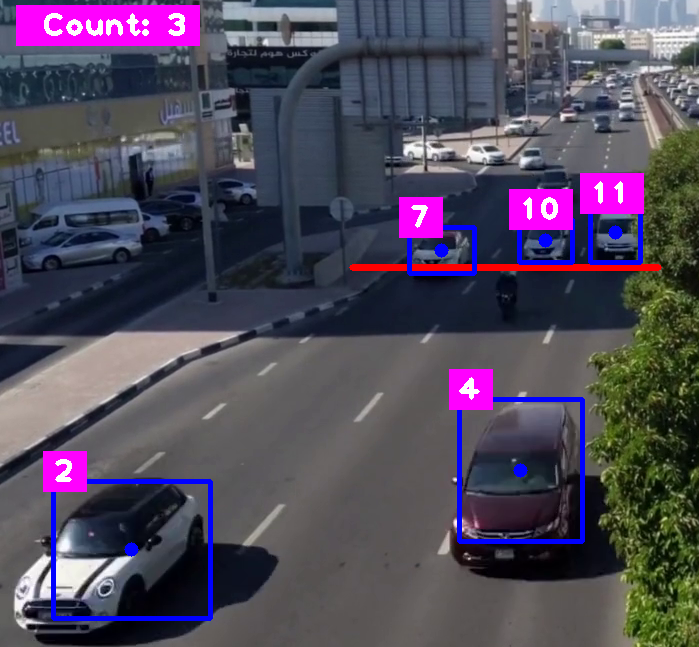
- In the one below it has already counted car 7 as number 3 as it entered the counting region
Color Change
If we want the line to change color as soon a centerpoint is detected we can add another line in green over the previous one inside the if/statement that checks if it is to be detected or not
cv2.line(frame, crossLine[0], crossLine[1], (255, 255 ,0), 5)
totalCount.append(Id)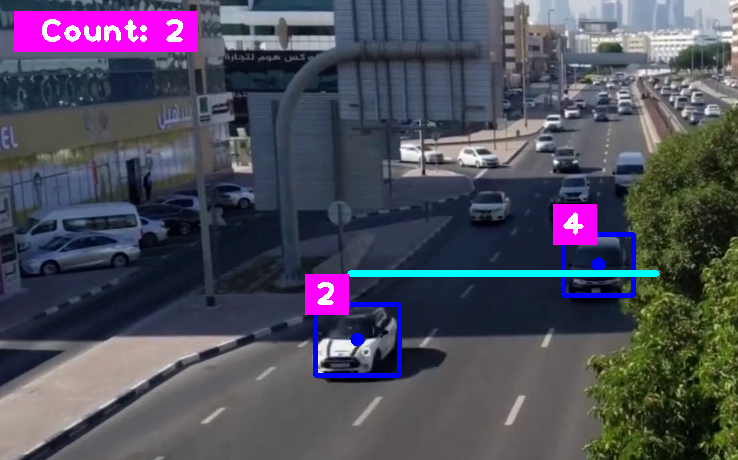
Background
- We can lay an image for the counter values
- Put it inside the while True loop right after we import the video and mask if applicable
- Then we overlay it over the video in the position desired at (0,0) in this case
- So we overlay the image and put it back into the frame
# background for counter
imgGraphic = cv2.imread("../graphics.png", cv2.IMREAD_UNCHANGED)
frame = overlayPNG(frame, imgGraphic,(0,0))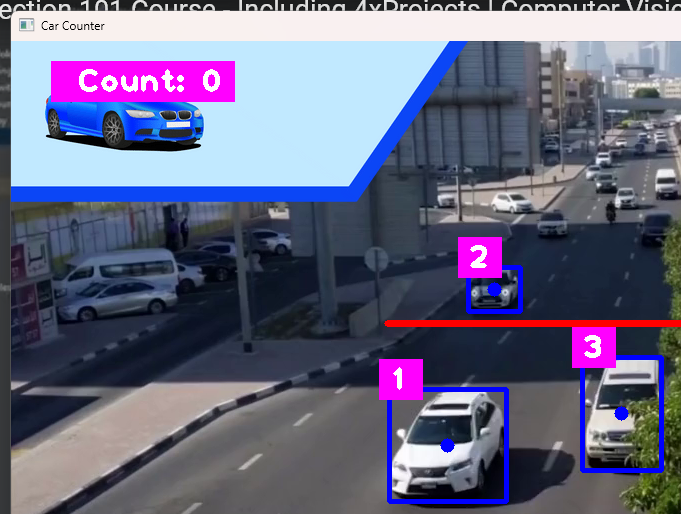
- Now we can print the count on it instead of the rectangle
- Comment out the previous textRect
#putTextRect(frame, f' Count: {len(totalCount)}', ((50, 50)), scale=2, thickness=3, offset=10)
cv2.putText(frame, str(len(totalCount)), (255,100), cv2.FONT_HERSHEY_PLAIN, 5,(50,50,255),8)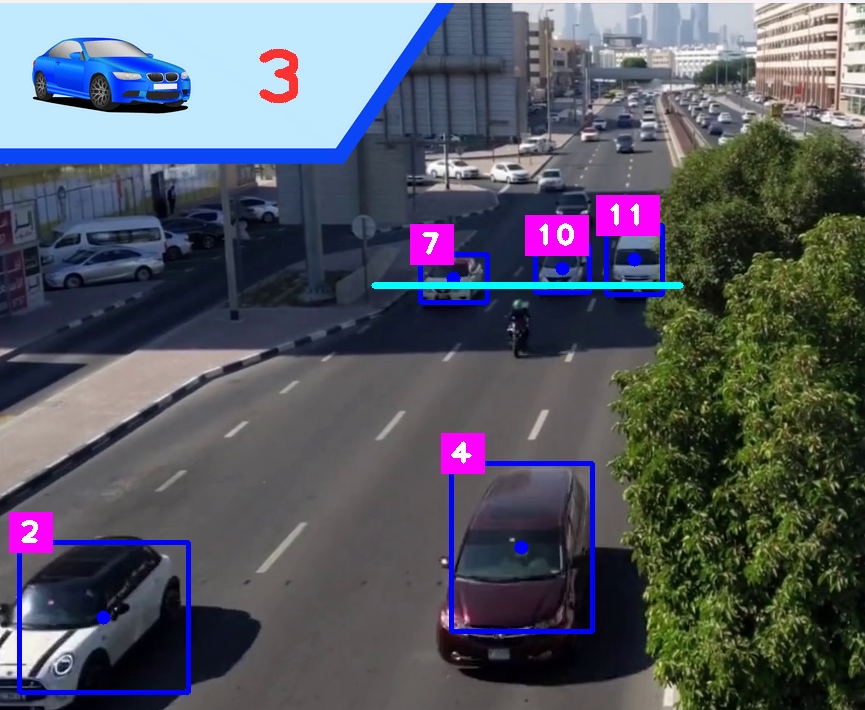
Code
- Code can be found in car_counter2.py
- To run the video without user input just change the value of the cv2.waitKey(1)
import numpy as np
from ultralytics import YOLO
import cv2  # we will use this later
import matplotlib as plt
import math
from cv_utils import *
from sort import *

cap = cv2.VideoCapture("../cars.mp4")  # For Video
mask = cv2.imread("../car_counter_mask1.png")   # For mask


# Create an instance for our tracker/sort
tracker = Sort(max_age=20, min_hits=3, iou_threshold=0.3)

# Create a line for the counter
crossLine = [(376, 282), (682, 282)]
totalCount = []

# Set the x,y where to overlay imgGraphic for the counter
x_img = 0
y_img = 0

win_name = "Car Counter"

model = YOLO("../Yolo-Weights/yolov8l.pt")

# List of Class names
classNames = ["person", "bicycle", "car", "motorbike", "aeroplane", "bus", "train", "truck", "boat",
              "traffic light", "fire hydrant", "stop sign", "parking meter", "bench", "bird", "cat",
              "dog", "horse", "sheep", "cow", "elephant", "bear", "zebra", "giraffe", "backpack", "umbrella",
              "handbag", "tie", "suitcase", "frisbee", "skis", "snowboard", "sports ball", "kite", "baseball bat",
              "baseball glove", "skateboard", "surfboard", "tennis racket", "bottle", "wine glass", "cup",
              "fork", "knife", "spoon", "bowl", "banana", "apple", "sandwich", "orange", "broccoli",
              "carrot", "hot dog", "pizza", "donut", "cake", "chair", "sofa", "pottedplant", "bed",
              "diningtable", "toilet", "tvmonitor", "laptop", "mouse", "remote", "keyboard", "cell phone",
              "microwave", "oven", "toaster", "sink", "refrigerator", "book", "clock", "vase", "scissors",
              "teddy bear", "hair drier", "toothbrush"
              ]

while True:
    success, frame = cap.read()     # read frame from video
    imgRegion = cv2.bitwise_and(frame, mask)        #place mask over frame


    if success:  # if frame is read successfully set the results of the model on the frame
        # import the graphic to overlay for our counter, overlay it and save it to frame
        imgGraphic = cv2.imread("../graphics.png", cv2.IMREAD_UNCHANGED)  # background for counter
        frame = overlayPNG(frame, imgGraphic,(0,0))
        # results = model(frame, stream=True)
        results = model(imgRegion, stream=True)     # now we send the masked region to the model instead of the frame

        # create a list of detections to use as input to tracker.update() below
        detections = np.empty((0, 5))

        # Insert Box Extraction section here
        for r in results:
            boxes = r.boxes
            for box in boxes:
                x1, y1, x2, y2 = box.xyxy[0]
                x1, y1, x2, y2 = int(x1), int(y1), int(x2), int(y2)  # convert values to integers
                #cv2.rectangle(frame, (x1, y1), (x2, y2), (0, 255, 0), 3)
                # we can also use a function from cvzone/utils.py called
                # cvzone.cornerRect(img,(x1,y1,w,h))

                # extract the confidence level
                conf = math.ceil(box.conf[0] * 100) / 100

                # extract class ID
                cls = int(box.cls[0])
                wantedClass = classNames[cls]

                # filter out unwanted classes from detection
                if wantedClass == "car" or wantedClass == "bus" or wantedClass == "truck" and conf > 0.3:
                # display both conf & class ID on frame - scale down the bos as it is too big - comment since we are displaying Id below
                    #cv2.rectangle(frame, (x1, y1), (x2, y2), (0, 255, 0), 3)
                    #putTextRect(frame, f'{conf} {classNames[cls]}', (max(0, x1), max(35, y1)), scale=0.6, thickness=1, offset=5)
                    currentArray = np.array([x1,y1,x2,y2,conf])
                    detections = np.vstack((detections,currentArray))

        # Call the sort/tracker function and extract results
        resultsTracker = tracker.update(detections)
        # Draw the line to cross for counter
        cv2.line(frame,crossLine[0], crossLine[1],(0,0,255),5)
        for result in resultsTracker:
            x1,y1,x2,y2,Id = result
            x1, y1, x2, y2 = int(x1), int(y1), int(x2), int(y2)  # convert values to integers
            print(result)
            # display new BB and labels
            cv2.rectangle(frame, (x1, y1), (x2, y2), (255,0,0), 3)
            putTextRect(frame, f'{int(Id)}', (max(0, x1), max(35, y1)), scale=2, thickness=3, offset=10)
            # midpoint would be x1 + half the width
            w = x2 - x1
            h = y2 - y1
            cx, cy = x1 + w // 2, y1 + h // 2
            # let's plot it on the image
            cv2.circle(frame,(cx, cy),7,(255,0,0),cv2.FILLED)

            if crossLine[0][0] < cx < crossLine[1][0] and crossLine[0][1] - 15 < cy < crossLine[0][1] + 15:
                if totalCount.count(Id) == 0:
                    cv2.line(frame, crossLine[0], crossLine[1], (255, 255 ,0), 5)
                    totalCount.append(Id)

        putTextRect(frame, f'{int(Id)}', (max(0, x1), max(35, y1)), scale=2, thickness=3, offset=10)
        #putTextRect(frame, f' Count: {len(totalCount)}', ((50, 50)), scale=2, thickness=3, offset=10)
        cv2.putText(frame, str(len(totalCount)), (255,100), cv2.FONT_HERSHEY_PLAIN, 5,(50,50,255),8)

        cv2.imshow(win_name, frame)     # display frame
        #cv2.imshow("MaskedRegion", imgRegion)   # display mask over frame
        key = cv2.waitKey(0)  # wait for key press
        if key == ord(" "):  # a space bar will display the next frame
            continue
        elif key == 27:  # escape will exit
            break


# Release video capture object and close display window
cap.release()
cv2.destroyAllWindows()